 JSON All-in-One

How to benchmark a large JSON viewer in Chrome
A benchmark is only useful when another engineer can understand what was measured, repeat the run, and separate the product's behavior from Chrome, hardware, storage, and source shape.
Use this guide as a benchmark protocol you can follow. Fill in results only after you run the measurement on a documented machine, source route, browser version, extension version, and fixture.
Define the input shape first
Large JSON is not one workload. A root array with many small records, one huge string value, a deeply nested object, a JSONL stream normalized to an array, and a high-cardinality export source can stress different systems.
Before measuring, record the exact generator, seed, byte size, record count, maximum record size, nesting depth, and whether the source is strict JSON, JSONC, JSONL, NDJSON, or another supported JSON-family format.
{
  "fixture": "orders-root-array-10gib.json",
  "generator": "scripts/generate-large-orders.mjs",
  "seed": "2026-09-04-a12",
  "bytes": null,
  "records": null,
  "maxRecordBytes": null,
  "format": "json",
  "notes": "Fill after generating and hashing the fixture."
}Record the environment
A Chrome benchmark without environment details is anecdote. Record operating system, CPU, memory, storage type, Chrome version, extension version, profile mode, file access setting, network route if HTTP is used, and whether any other extensions are enabled.
Use a clean profile for benchmark runs. If you compare file://, file picker, and HTTP routes, label them separately. They are different acquisition paths and can produce different browser-side behavior.
| Field | Value |
|---|---|
| Chrome version | Record the exact Chrome version used |
| Extension version | Record the exact extension version used |
| Hardware | Record CPU, RAM, and storage type |
| Route | file://, picker, or HTTP, measured separately |
Measure phases separately
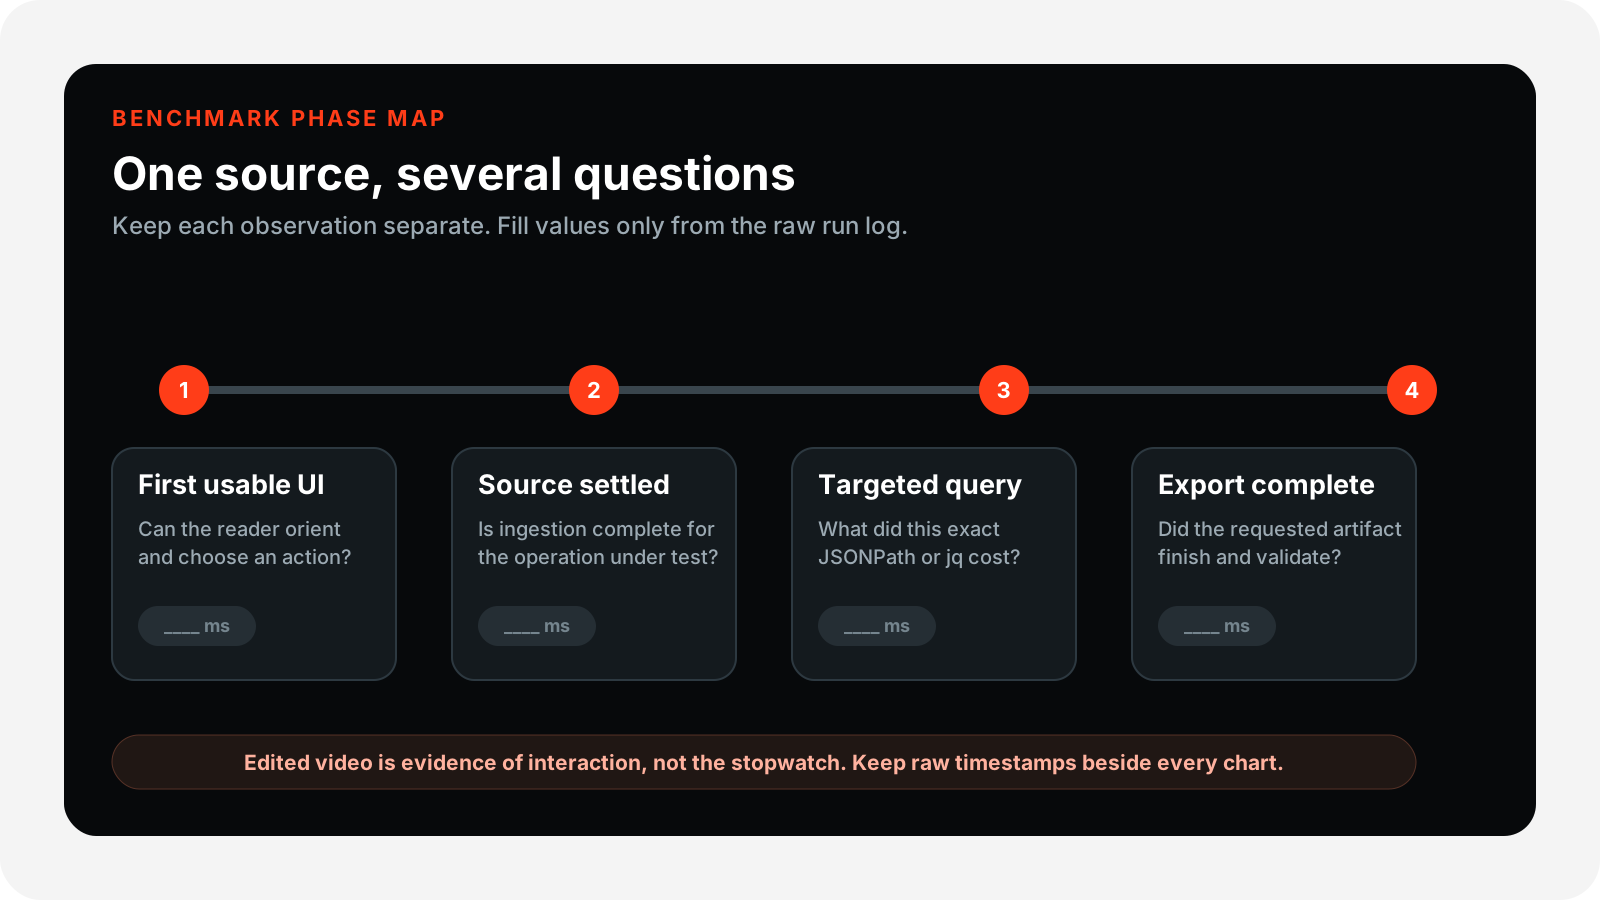
Separate the benchmark into phases instead of one vague loaded/not-loaded number. Track first visible UI, completed ingestion, first tree navigation, direct search, broad search, JSONPath, JQ, export, copy, and download. Each phase answers a different user question.
Keep raw timestamps or event logs beside any chart. If a screen recording is edited for pacing, use the log rather than the video as the timing source.
| Phase | Question answered | Measurement status |
|---|---|---|
| First visible UI | How soon can the reader orient themselves? | Measure from navigation or picker confirmation to first usable viewer state |
| Ingestion complete | When is the source fully processed? | Measure when the source is fully processed for the operation being tested |
| JSONPath or JQ | How does a specific operation behave? | Measure each expression separately |
| Export | Can the requested artifact complete? | Measure each export format separately |
Separate memory and storage metrics
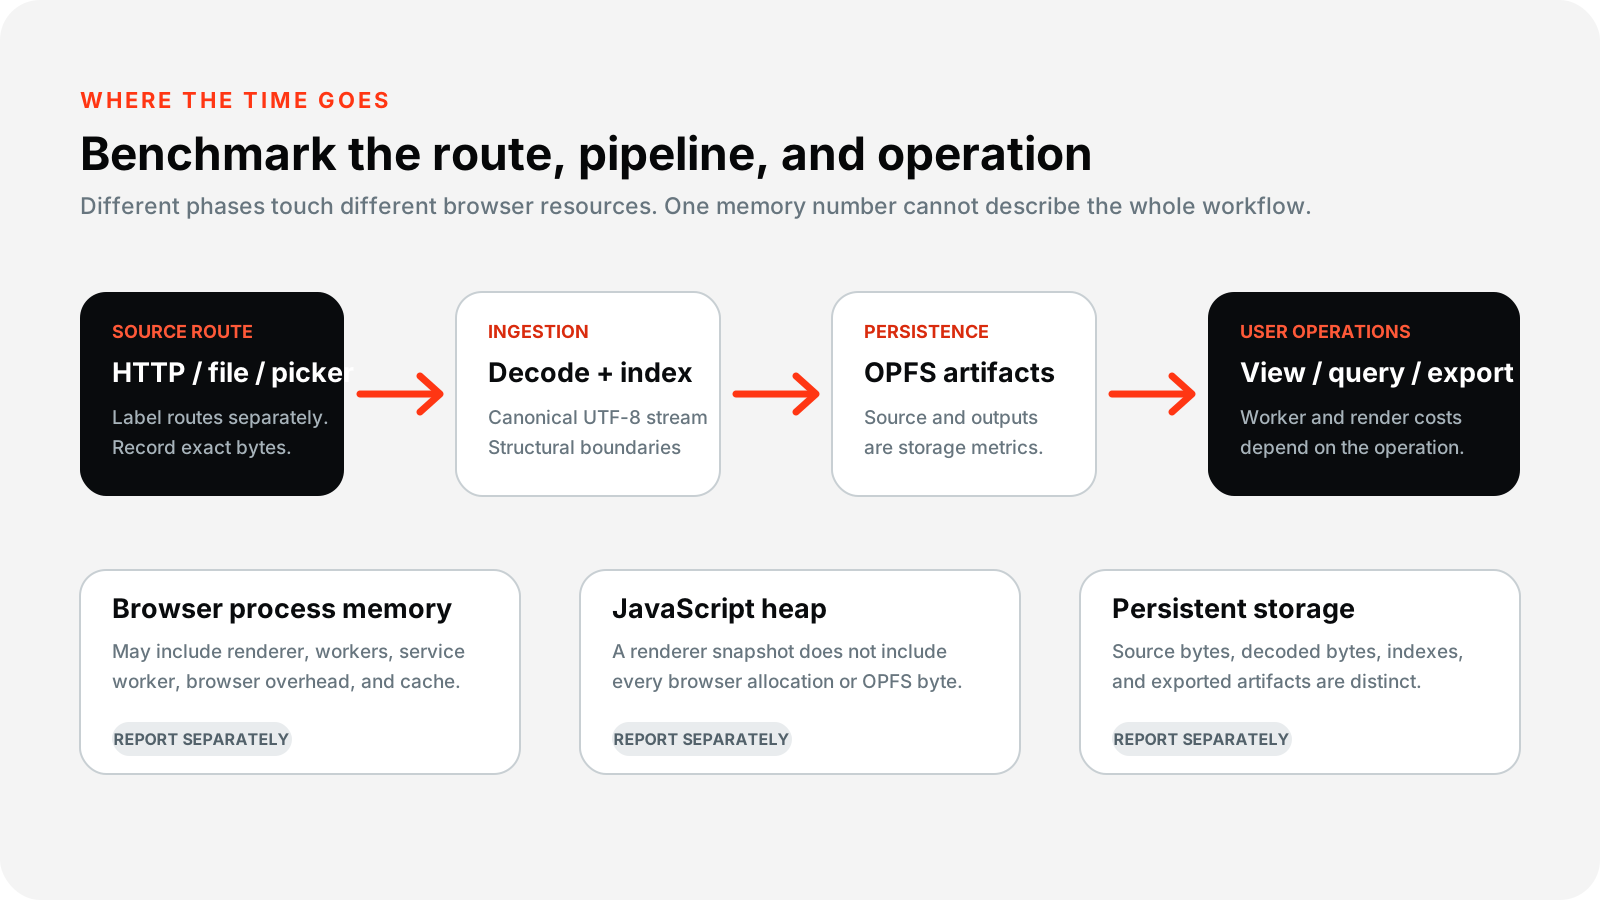
Process memory, JavaScript heap, OPFS or persistent storage size, downloaded bytes, decoded bytes, and output artifact bytes are different measurements. Label them separately and avoid using one heap snapshot as proof for every operation.
For Chrome, also distinguish the source page, extension renderer, service worker, and any worker process when the tools available to you allow it. If a metric cannot be collected reliably, say so rather than filling the table with guesses.
{
  "runId": "a12-release-001",
  "phase": "first-visible-ui",
  "route": "file-picker",
  "elapsedMs": null,
  "jsHeapBytes": null,
  "processMemoryBytes": null,
  "opfsBytes": null,
  "notes": "No value until measured from the release run."
}
Explain architecture and limits
A credible benchmark explains why the phases differ. For JSON All-in-One, source routing, incremental decoding, canonical UTF-8 streams, OPFS-backed artifacts, worker-based tasks, lazy rendering, and operation-specific outputs can all affect what the user sees.
Limits belong in the benchmark too. One giant record can be worse than many small records. Recursive queries can be expensive. Sorting and export may need different intermediate data than collapsed viewing. Failed or aborted runs should be reported, not erased.
Compare under matching conditions
Only compare other tools if the same fixture, machine, Chrome version or app version, source route, warm-up rules, and phase definitions are documented. If those conditions are not met, publish a single-product case study instead.
A fair comparison also respects product differences. A command-line tool, browser extension, desktop app, and online converter may make different tradeoffs about privacy, storage, streaming, rendering, and output formats.
Use the results carefully
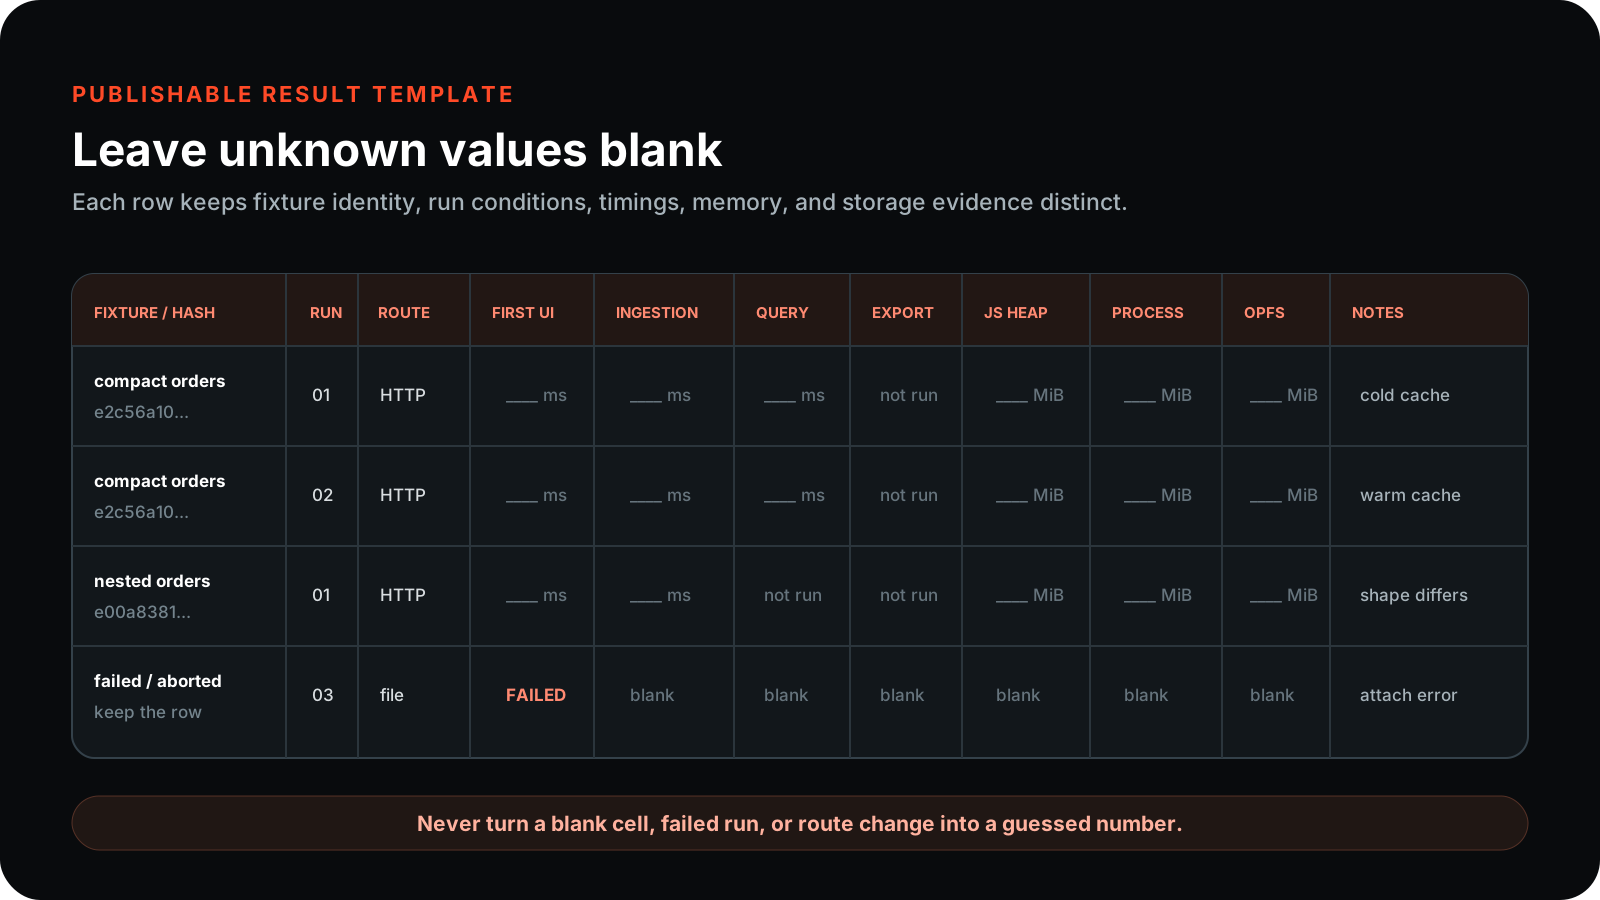
Leave a cell blank when you did not measure it. Mixing measured values with guesses makes the table less useful than no table at all.
Historical internal diagnostics can help choose what to measure. Copy them into a benchmark report only when you can reproduce the fixture, environment, route, phase definition, and raw result. For the practical inspection workflow, return to Open large JSON files in Chrome.
Keep going
Open large JSON files in Chrome
A practical local workflow for inspecting large JSON files in Chrome while choosing operations that fit the data shape.

How to use JQ: practical JSON filter examples
Copyable JQ examples for extracting fields, filtering arrays, reshaping objects, and grouping JSON records.
JSONPath examples for nested objects and arrays
Learn supported RFC 9535 JSONPath patterns for selecting fields, array items, recursive matches, and filtered records.
Why large JSON numbers change in JavaScript
Reproduce JavaScript number rounding, distinguish JSON number tokens from runtime numbers, and choose safer handoff representations.